Third Place Urban Analysis
During Harvard’s J-Term, I participated in Namju “NJ” Lee’s course on computational urban analytics. As a case study , we performed an urban analysis of the City of Boston, Massachusetts to understand “third place” distribution. A Logistic Regression model was trained on data collected through the Google Places API to determine the probability that an urban feature would be a “third place”. The model of Boston was then compared with models trained on data of Los Angeles, California and Honolulu, Hawai‘i to contrast each model’s interpretations of Third Place-ness in different urban contexts.
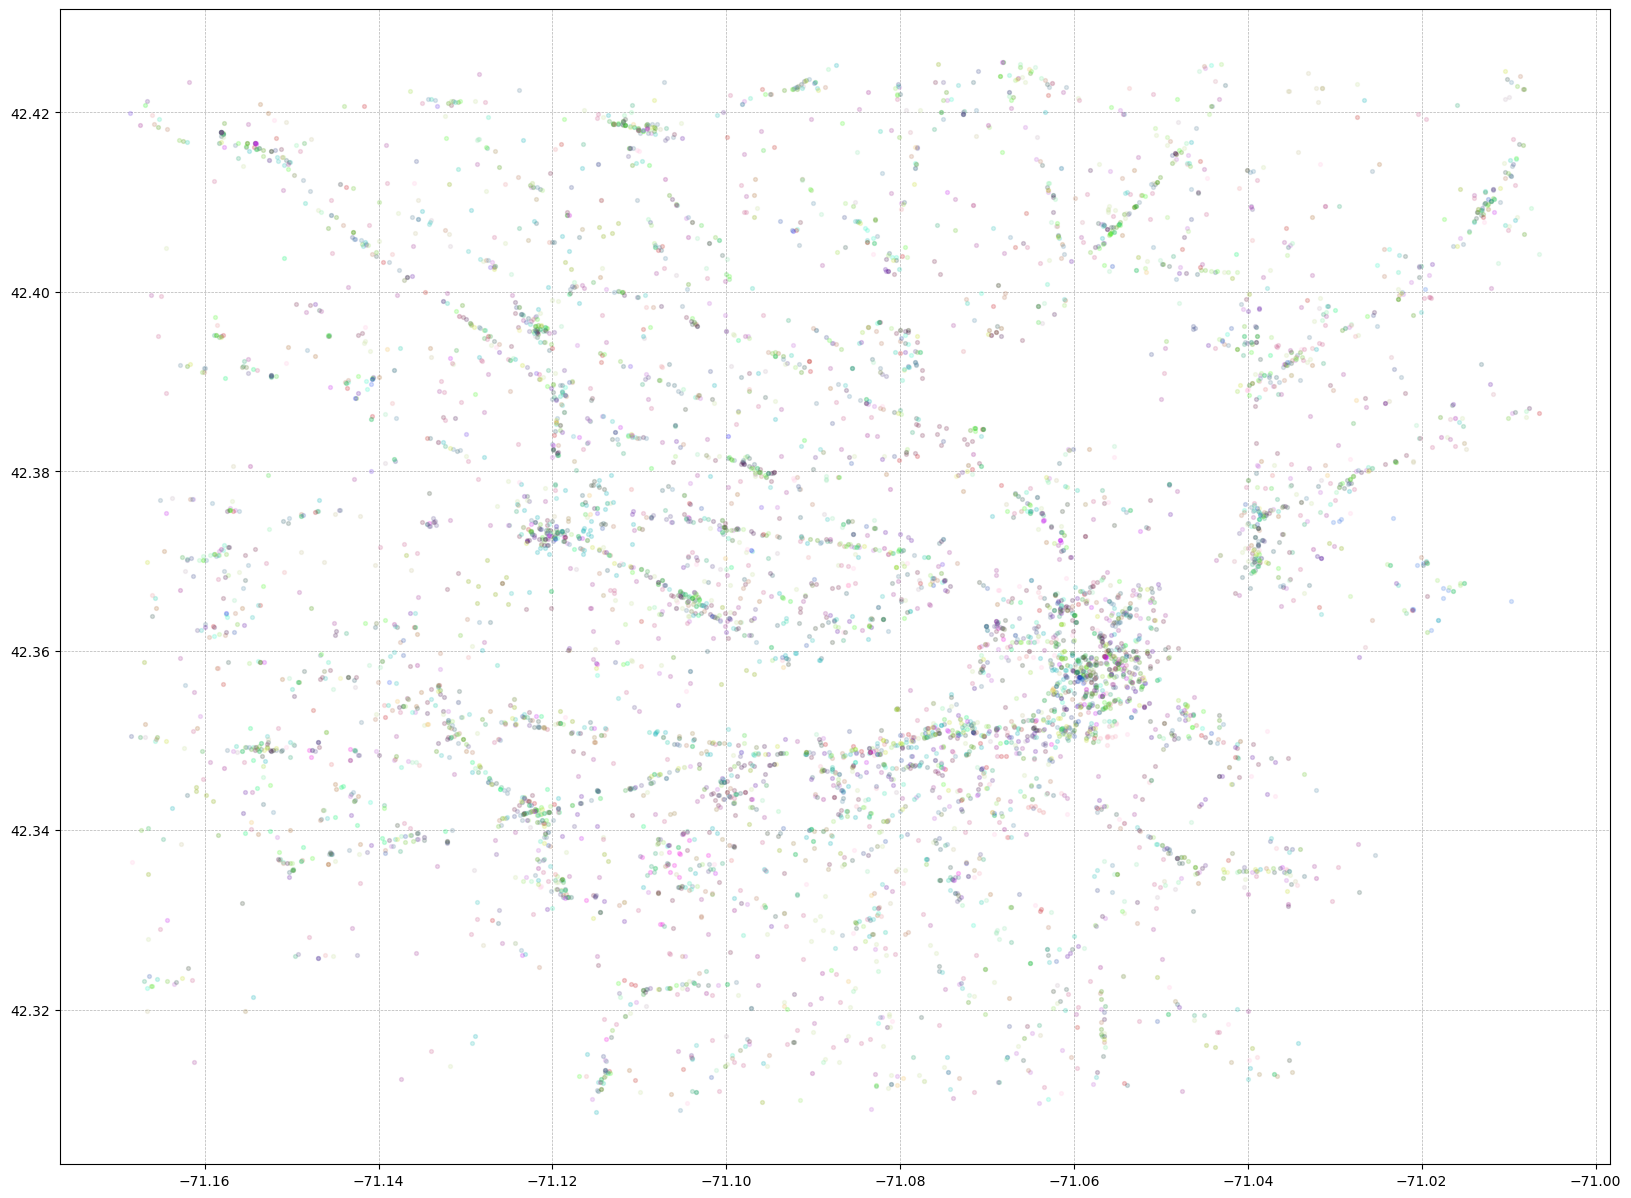
Plot of Boston Third Place data collected from the Google Places API.
![]()
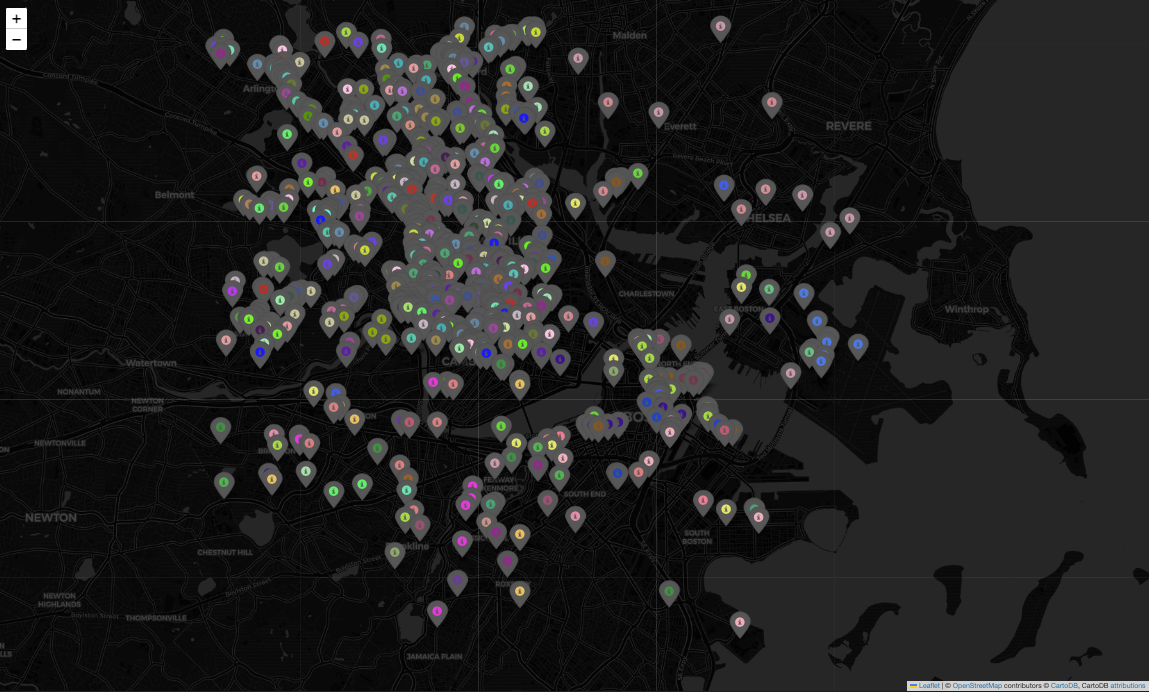
Map visualization of Google Places urban data for City of Boston.
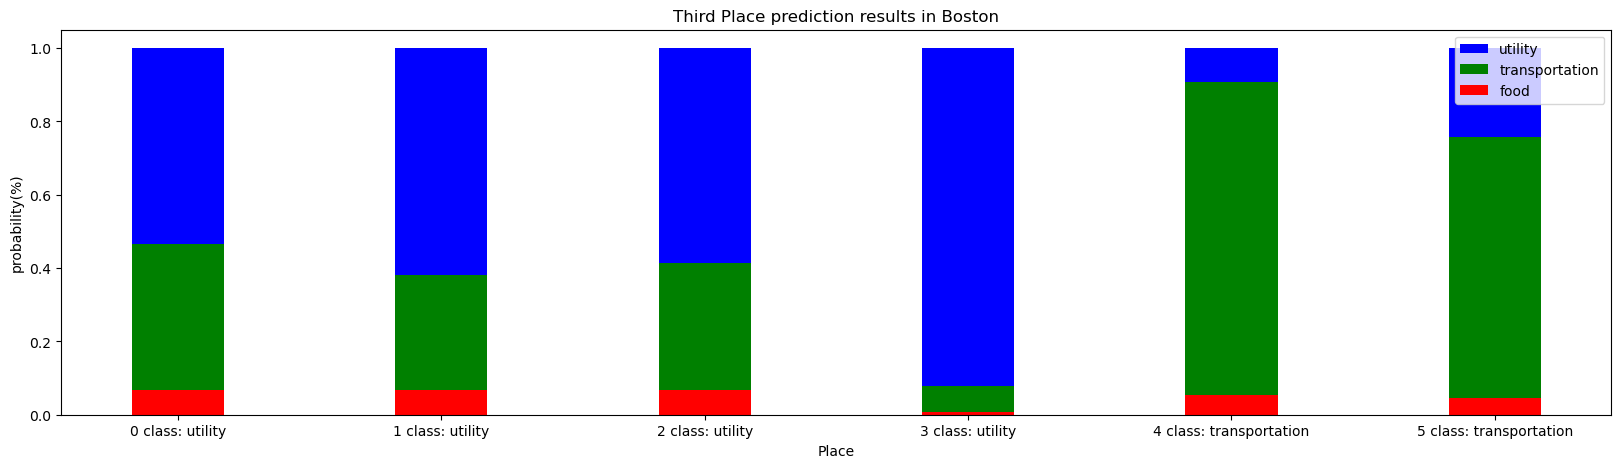
![]() Third Place predictions by Place Types in Boston.
Third Place predictions by Place Types in Boston.
![]()
Dominant Third Place by Area in Boston.
 Third Place predictions by Place Types in Boston.
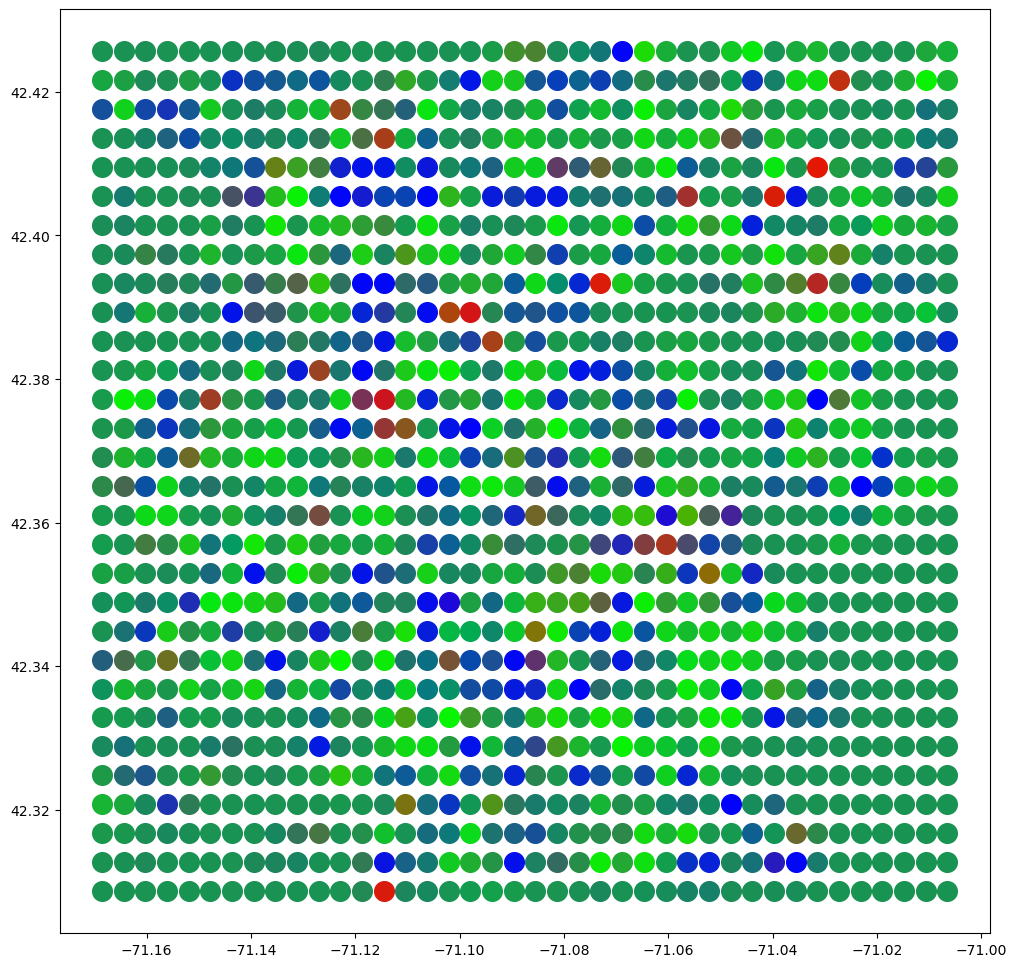
Dominant Third Place by Area in Boston.
(This project documentation is still in progress)