Urban UX Data Visualizations
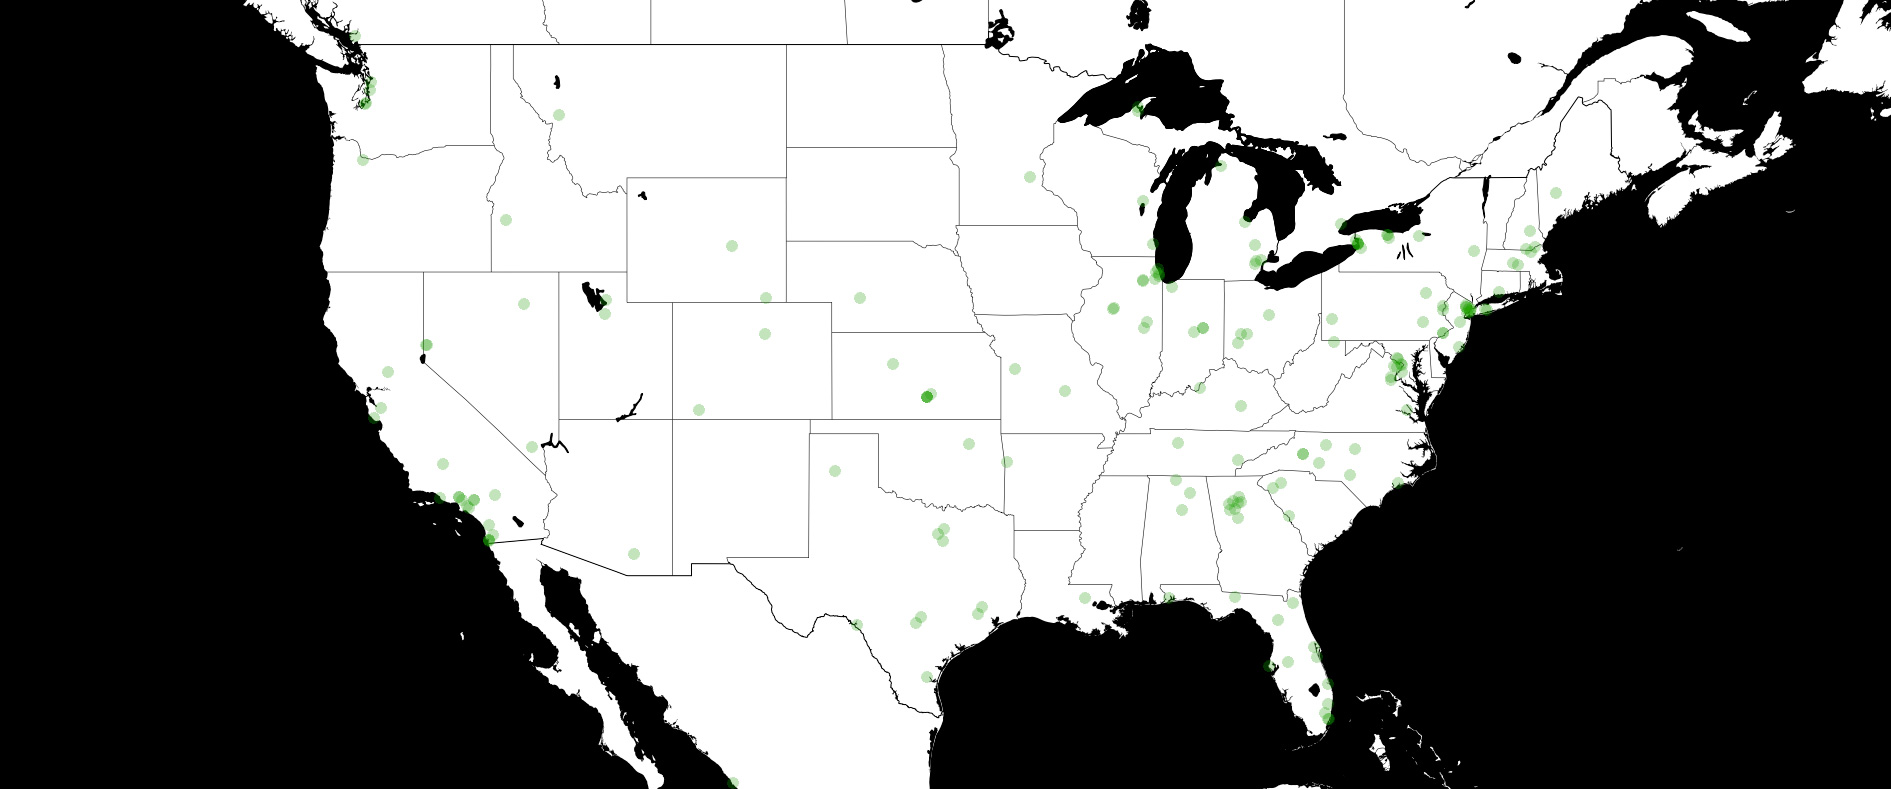
While at AILSV, I contributed to several other teams as needed. I began by helping researchers at Stanford University’s Center for Design Research design studies, assist with prototype development, consult student work, and perform data analysis. As part of these tasks, I created a visualization of mTurk data representing respondents of surveys asking about social interaction preferences in current rideshare scenarios, such as Lyft or Uber. We used these rideshare services as an early model to project how to understand and anticipate preferences and expectations for social interactions and design future robotaxi services.
This project was very open-ended, as we were not sure what insights we would get. I explored a range of visualizations to assess how drivers interacted within the urban landscape and reported traffic incidences.
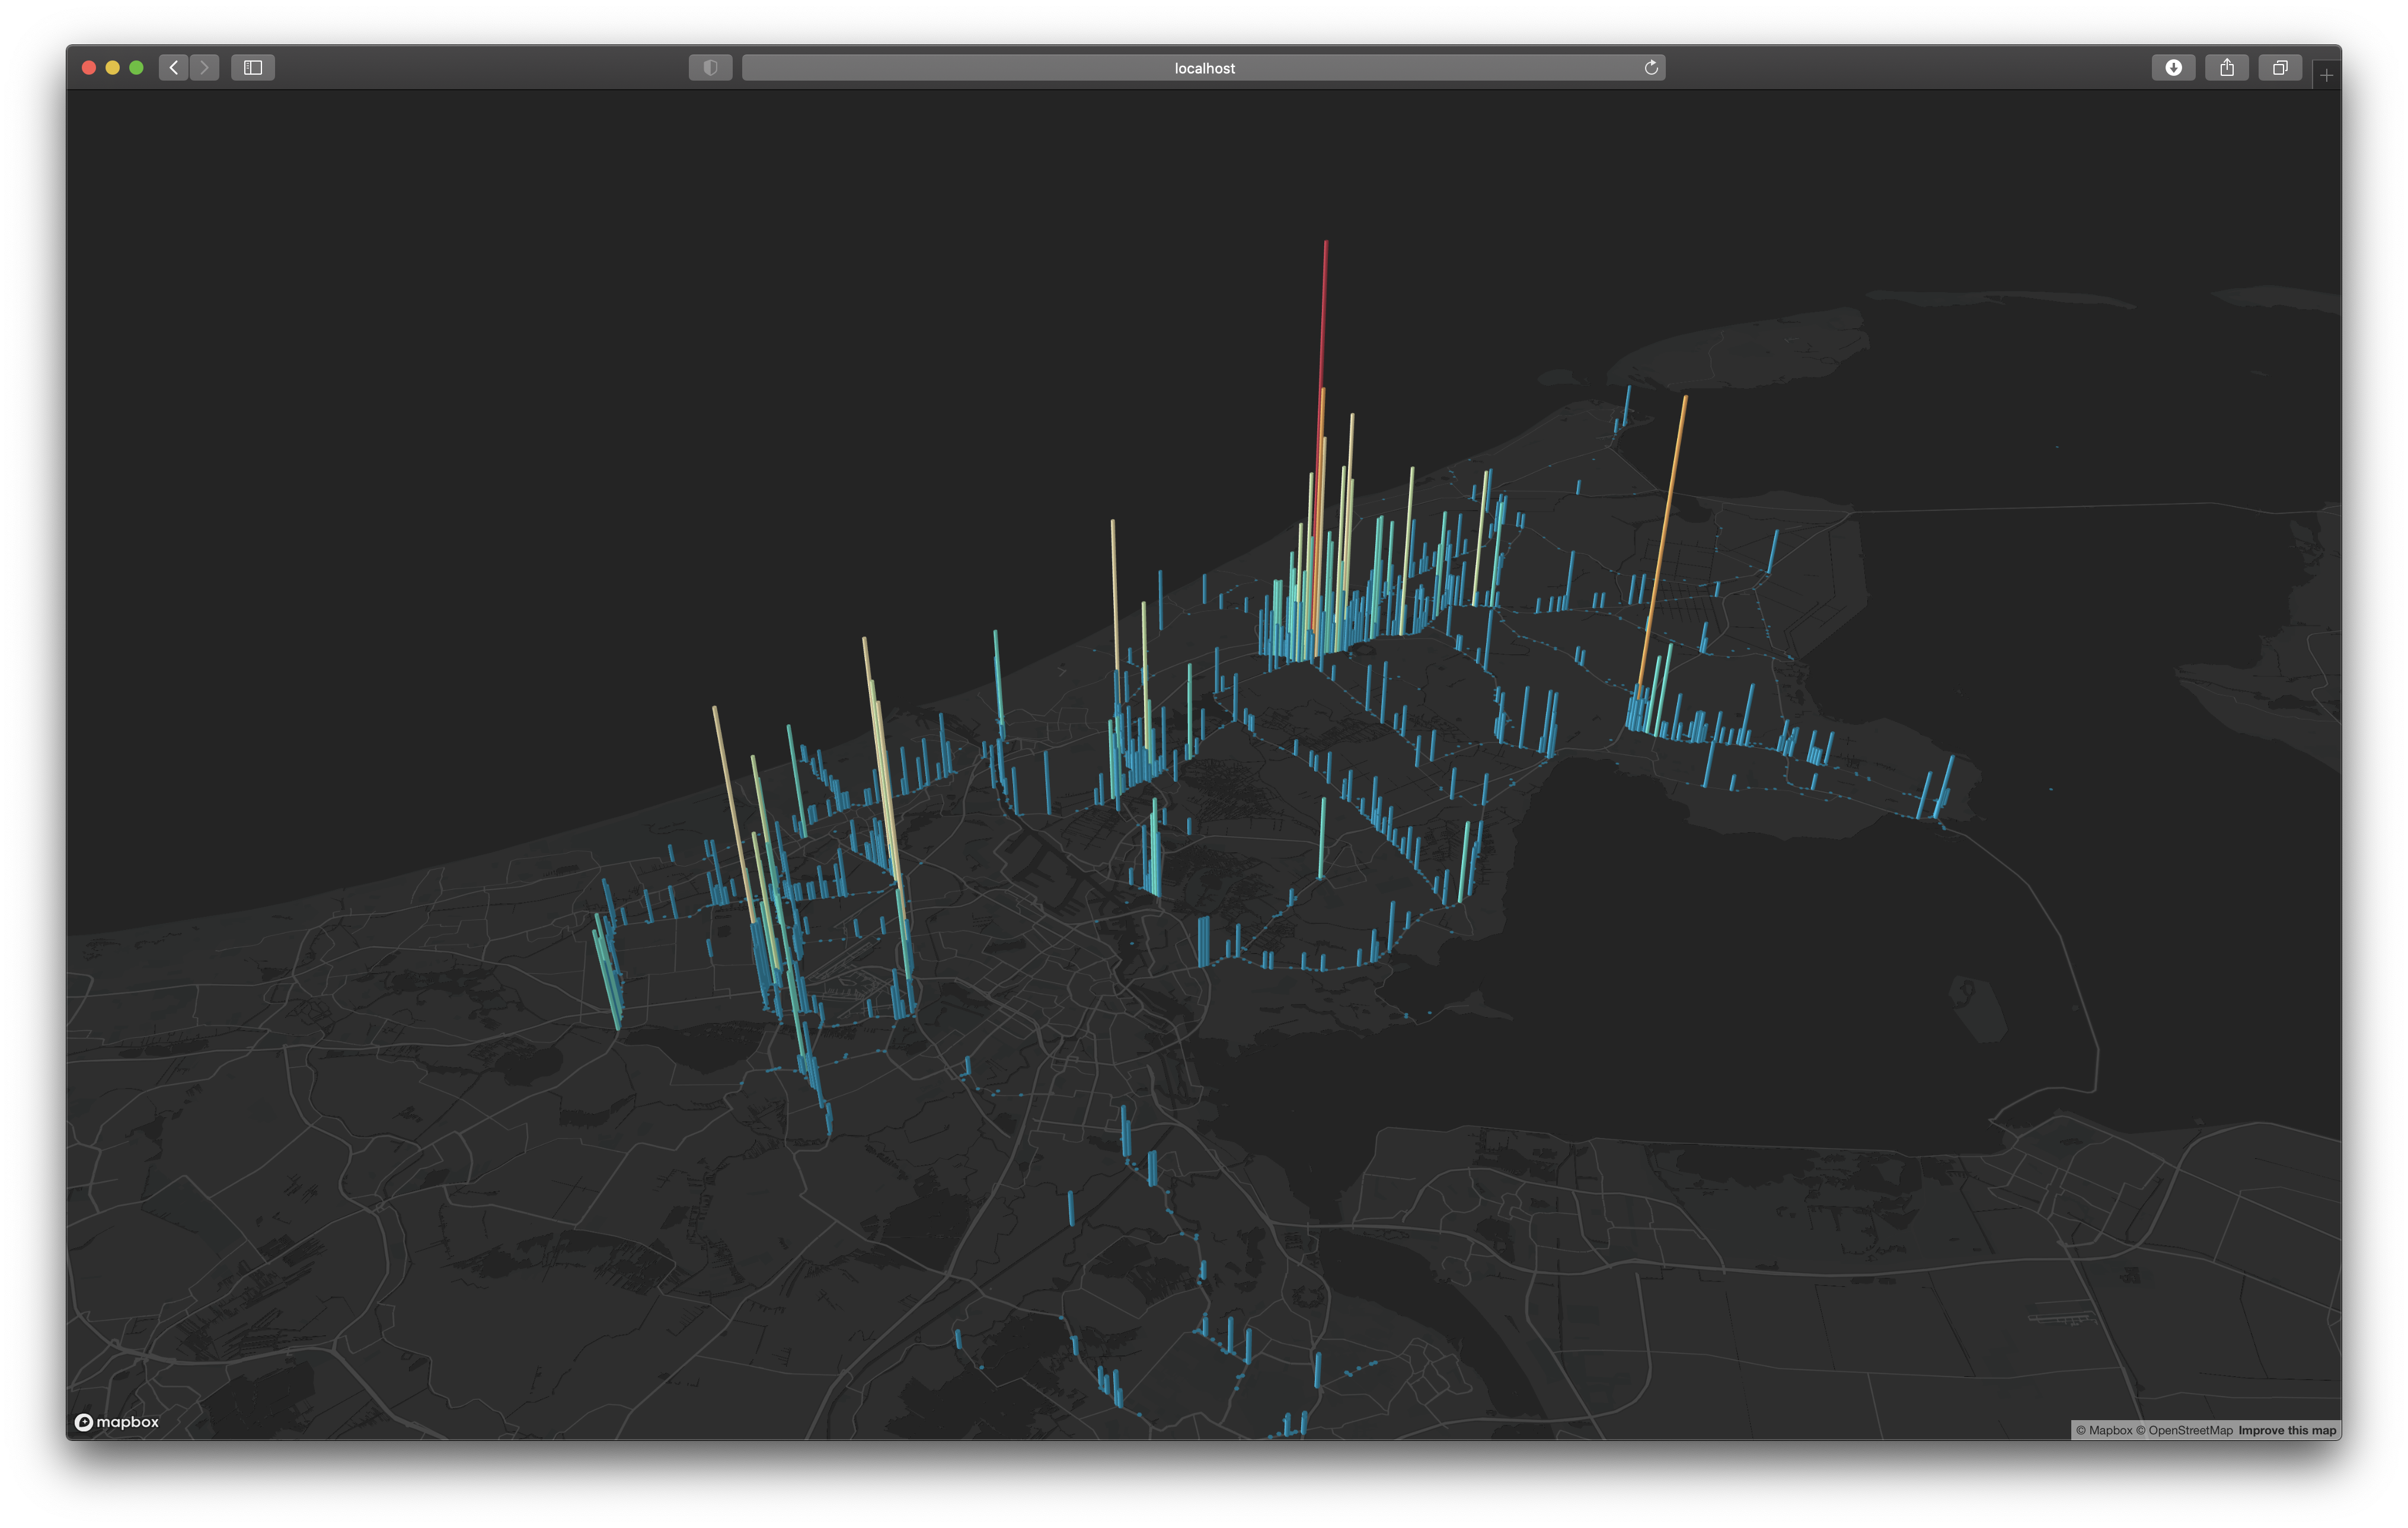
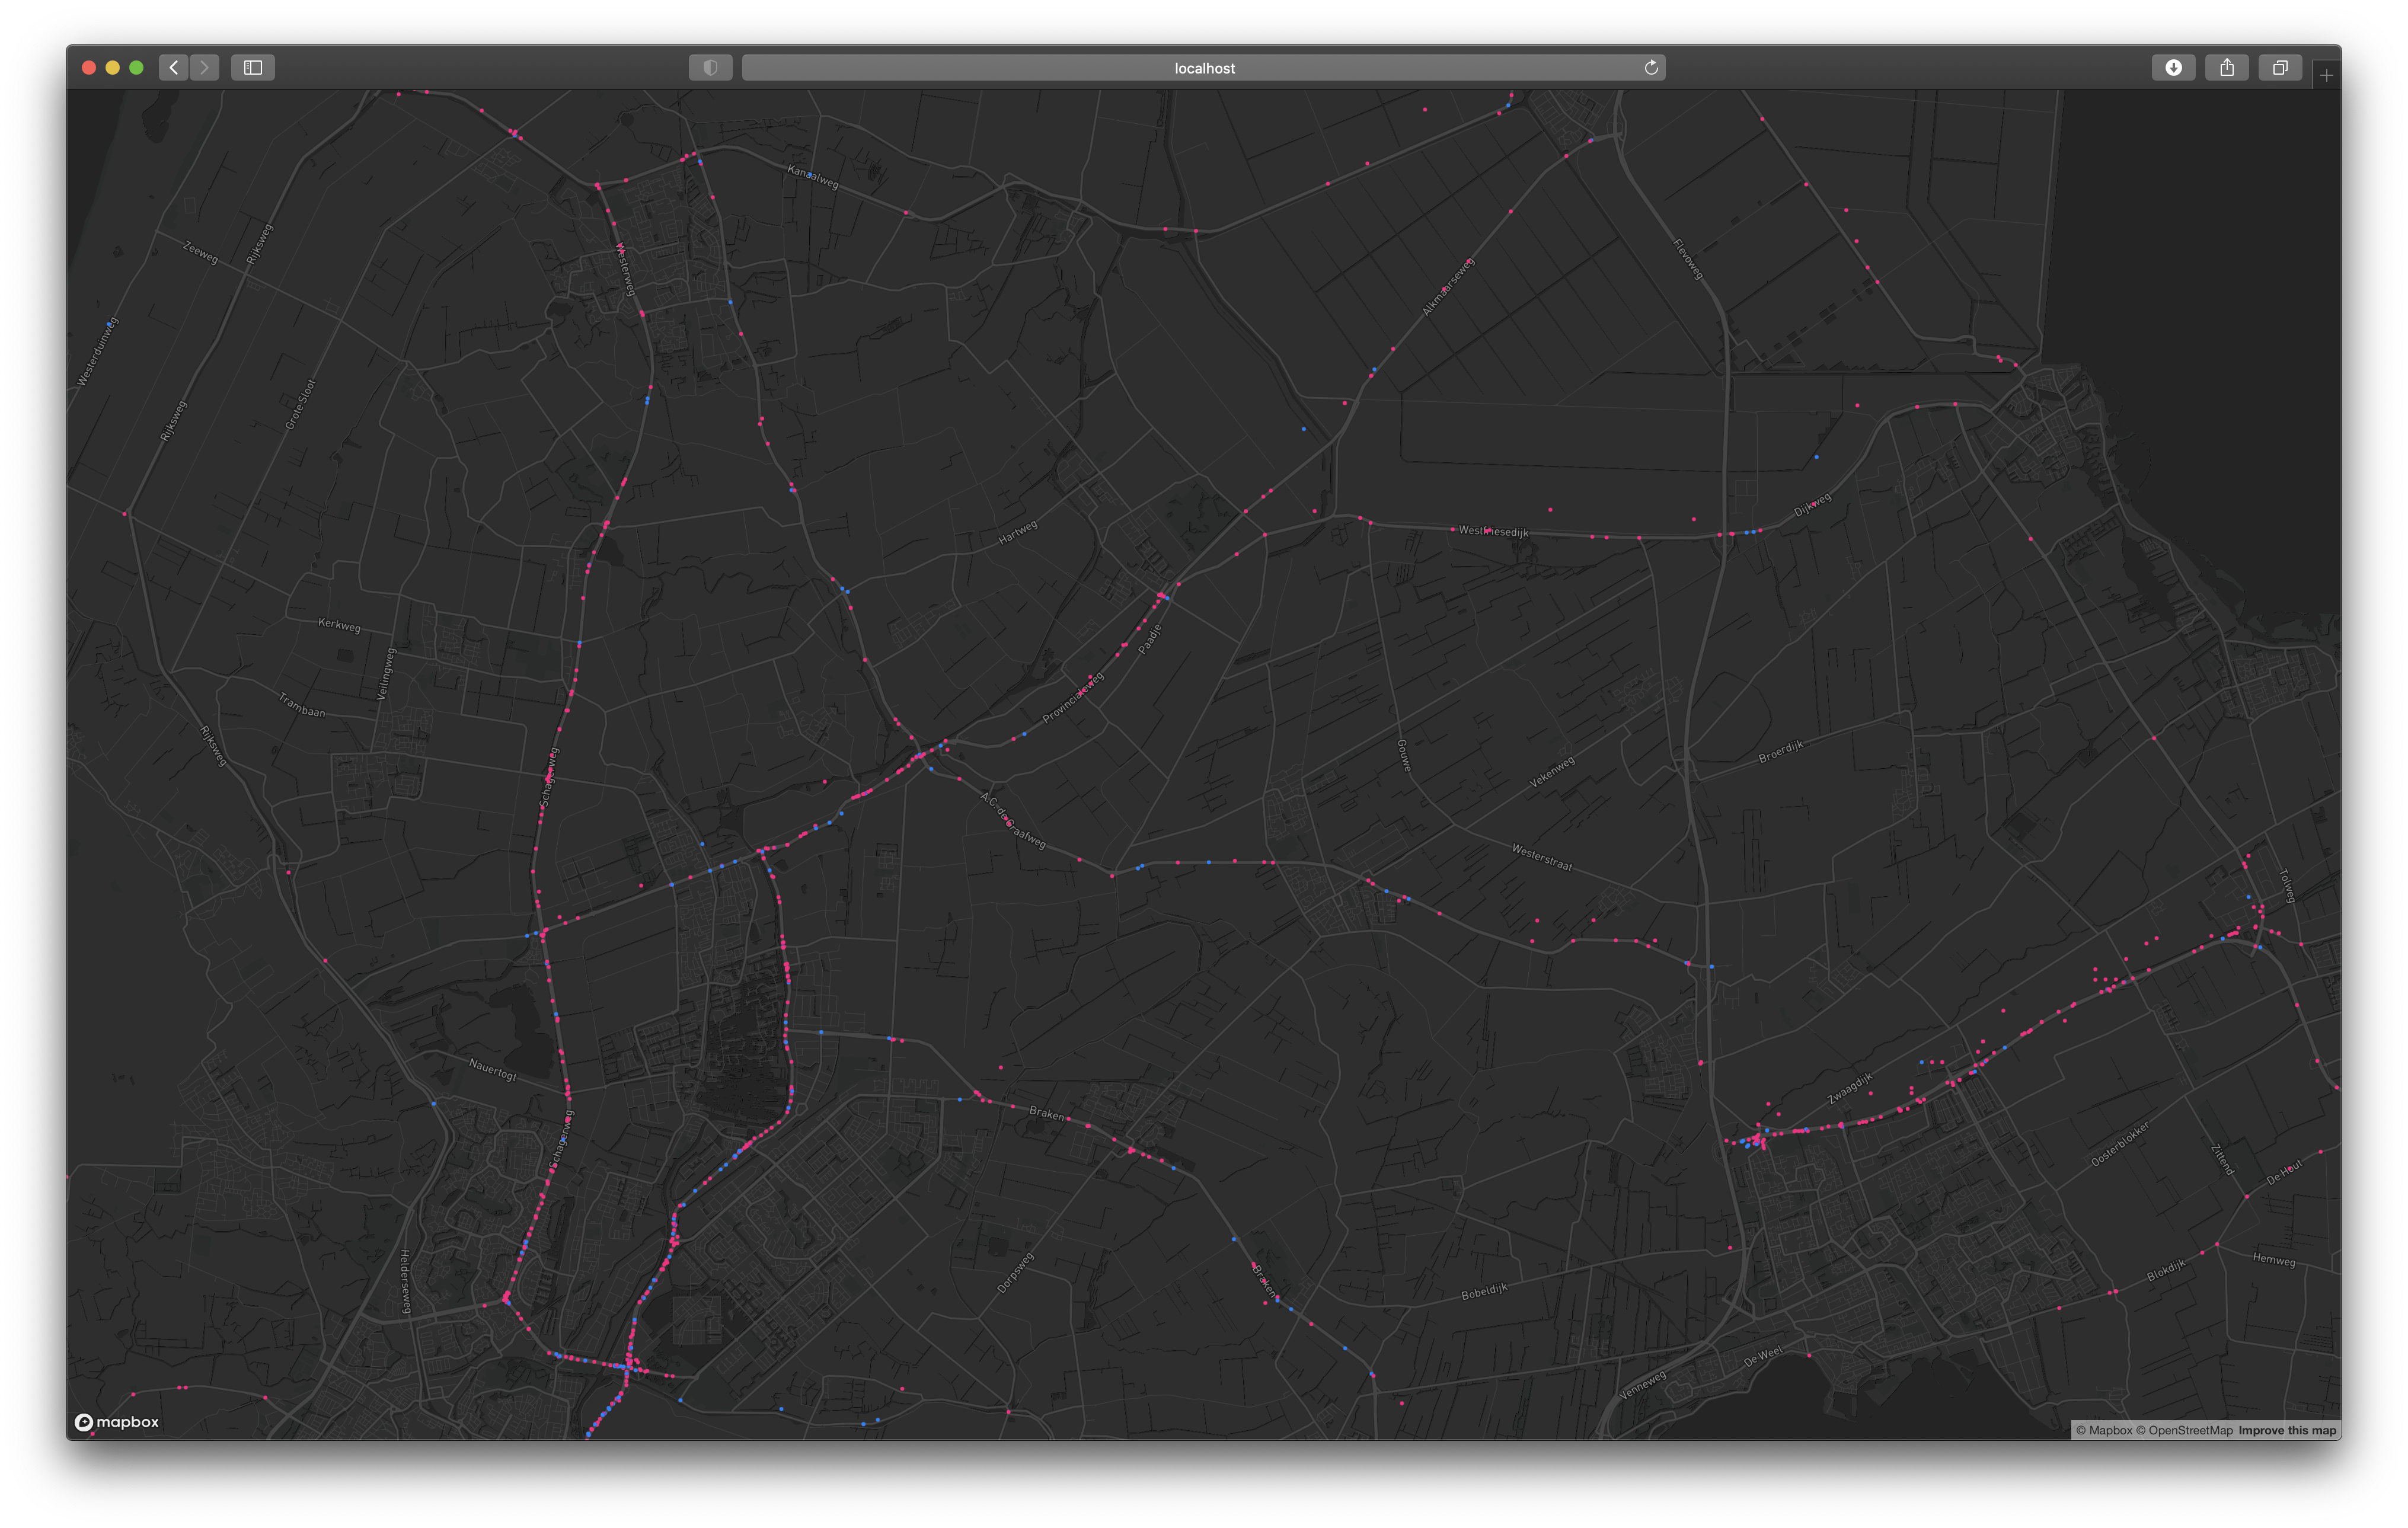
The images here represent a project in collaboration with a team of researchers at the Renault-Nissan-Mitsubishi Alliance Innovation Lab and the municipality of North Holland. I was provided a large data set and asked to explore it to uncover any insights. I used React and Uber’s deck.gl framework to create these visualizations of traffic incidents in North Holland. The above image shows the frequency of incidents according to location, and the image to the right displays incidents reported by gender.
Visualization of traffic incidences in collaboration with a municipality. Working on this project allowed me to work with a relatively large data set as well as the deck.gl and react-map-gl libraries. This was a very open-ended project as we were not sure what insights we could get. A range of visualizations were explored in order to better assess how drivers interacted within the urban landscape and reported / experienced traffic incidences.
This visualization was built in Processing with the Unfolding Maps library (thank you to Till Nagel for providing the P3 beta) to dynamically show the distribution of responses from mTurk platform. Over 250 raw responses were cleaned and reduced to 182 complete, valid submissions; these were then coded to gather insights on user perceptions and experiences within existing ride-hail / ride-share (Uber or Lyft) contexts.